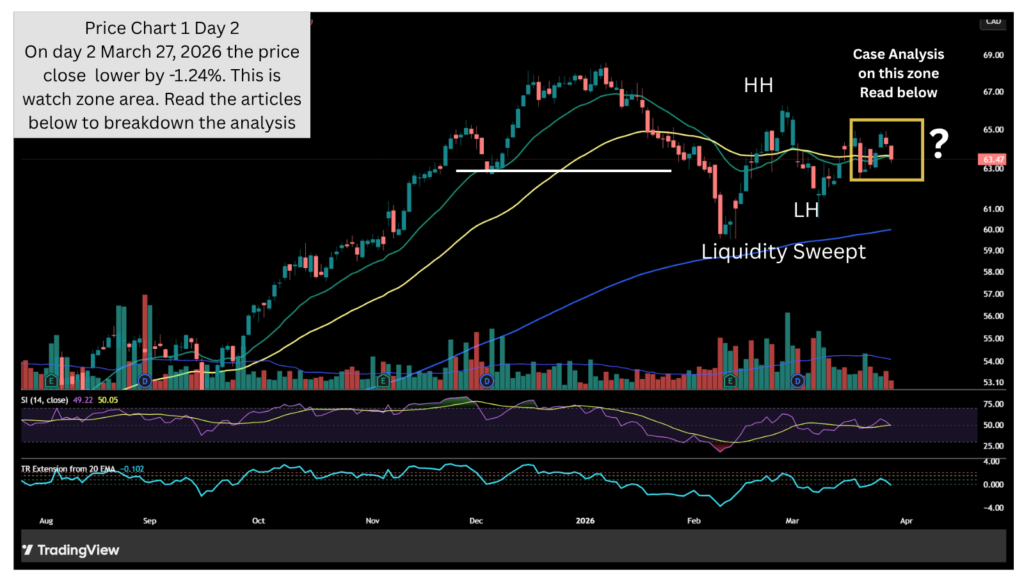
Break of Structure or Liquidity Sweep? A Look at the Pullback
This case study examines the recent pullback in the S&P/TSX Composite Index, where price broke below a previous swing low. The goal is to understand whether this move represents a true structural shift or a liquidity sweep before continuation.
- Higher highs
- Higher lows
- Clean bullish structure
This context matters because strong trends often pause or pull back when they reach liquidity-rich zones.
- A lower low
- A potential break of structure (BOS)
- A possible change of character (CHoCH)
- Clean
- Controlled
- Not impulsive
This keeps the possibility of a liquidity sweep alive.
3. Liquidity Behavior: Was This a Stop‑Run?
- Stops below the low were triggered
- Late sellers entered
- Smart money may have used the move to accumulate
- A quick reclaim of the broken level
- A strong reaction upward
- A higher low forming shortly after
These are the clues to watch next.
4. Reaction Zone: Price Pulls Into a Key Area
- A previous bullish displacement
- A strong rejection wick
- A clear shift in control earlier in the trend
- Buyers previously defended it
- It represents fair value
- It often acts as a decision point
If buyers step in again, the structure may recover.
5. The Decision Point: Higher Low or Breakdown?
- Selling pressure was absorbed
- Liquidity was swept
- Trend continuation becomes likely
- The BOS was genuine
- A deeper pullback may unfold
- Short‑term sentiment shifts bearish
This is the moment where the market reveals its intent.
6. Indicators Support the Pullback Narrative
- RSI in the low‑40s → momentum cooling
- Price below 20 EMA and 50 EMA → short‑term pressure
- Volume increased on the drop → participation confirmed
These support the idea of a meaningful pullback, but not necessarily a trend reversal.
⭐ Key Lessons From This Case Study
Sometimes it’s just a liquidity sweep.
Watch how price behaves when it returns to areas where buyers previously stepped in.
A higher low after a sweep is one of the strongest continuation signals.
They don’t predict — they support the story.
⭐ Summary
The next higher low — or failure to form one — will determine whether this was:
- A true shift in structure, or
- A stop‑run before continuation
This is the decision point.