- Case Analysis – Day 2: Price Behavior Inside the Watch Zone
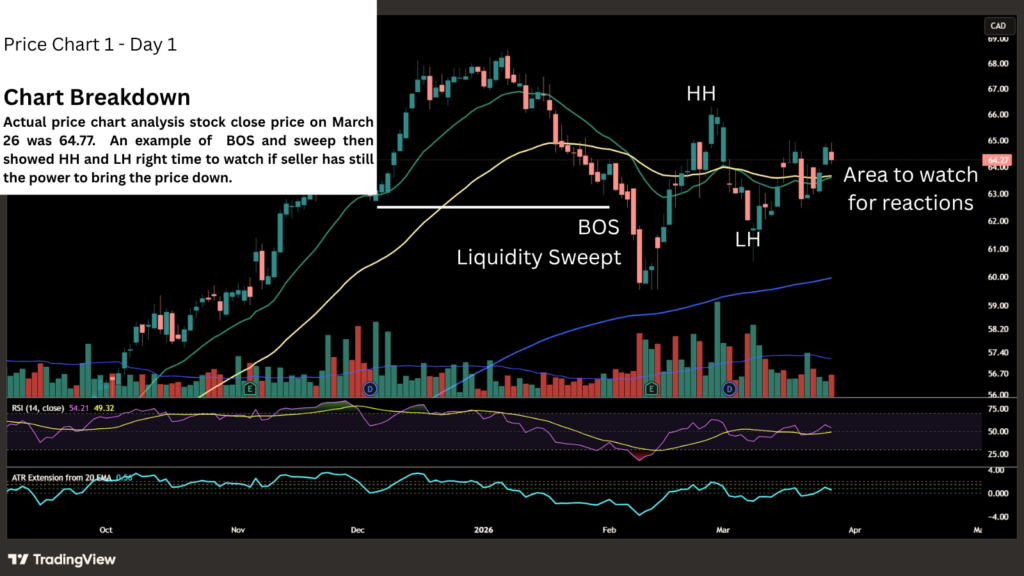
Following the liquidity sweep and the formation of a Higher High (HH) and Higher Low (HL) on March 26, we now move into the watch zone—the area where price often reveals whether the sweep was a true shift in intent or simply a temporary reaction. This zone is where traders must slow down, observe, and let the market speak.
On March 27, the stock closed –1.24% on the TSX. The candle attempted to push slightly above the previous day’s low, showing early signs of buyer defense, but the market couldn’t sustain that strength. Sellers stepped back in and dragged price lower into the close. This type of candle doesn’t confirm anything yet; instead, it signals hesitation and invites deeper bar‑by‑bar observation.
Bar‑by‑Bar Interpretation
- The intraday high briefly tested above the prior day’s low — a subtle attempt at reclaiming the zone.
- Failure to hold that level shows sellers still have influence.
- This candle becomes part of the “story” rather than a signal by itself.
- What we want to see next is a candle that sweeps the previous day’s low and recovers, followed by HH and HL on a candle‑by‑candle basis.
Until that happens, we remain patient. The watch zone is not an entry — it’s a diagnostic area.
Trading Psychology: Why This Zone Matters
This is where the mental game becomes just as important as the chart.
Many traders sabotage themselves by needing to be right. They want the sweep to be the reversal. They want the watch zone to be the entry. They want the market to validate their expectation.
But trading doesn’t reward ego — it rewards discipline.
Needing to be right brings destruction. Acceptance keeps you in the game.
When the market moves against your expectation, the correct mindset is simple: The probability didn’t play out this time. That’s it. No drama. No emotional attachment.
If your system gives you a 60% win rate with a 1.5:1 reward‑to‑risk, you don’t need perfection. You need consistency. You need to follow your rules. You need to let the math work.
The watch zone teaches patience, humility, and the discipline to wait for confirmation instead of forcing a narrative.
What to Look For Next
As the next candles develop, the key signals remain:
- A sweep of the previous day’s low with recovery
- Followed by HH and HL on a candle‑by‑candle basis
If these appear, the Day 1 sweep gains credibility. If not, the market may simply be reacting before continuing lower. Either outcome is acceptable — because disciplined traders respond to the market, not their expectations.
Learn More: Recommended Reading Path
- To understand how HH, HL, LH, and BOS form the foundation of this analysis, explore the full breakdown inside our Market Structure page.
- If you want to dive deeper into why liquidity sweeps occur and how they create opportunity, visit the Liquidity Zones section in the Learn menu.
- For traders studying how price reacts inside key areas like this watch zone, the Reaction Zones page provides a clear framework you can apply immediately.
- When the market transitions from reaction to reversal, the concepts inside our Turning Zones guide will help you identify those critical shifts with confidence.
- Case Study — S&P/TSX Composite Index (March 23 Close)
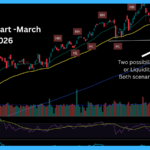
Break of Structure or Liquidity Sweep? A Look at the Pullback
- Higher highs
- Higher lows
- Clean bullish structure
This context matters because strong trends often pause or pull back when they reach liquidity-rich zones.
- A lower low
- A potential break of structure (BOS)
- A possible change of character (CHoCH)
- Clean
- Controlled
- Not impulsive
This keeps the possibility of a liquidity sweep alive.
3. Liquidity Behavior: Was This a Stop‑Run?
- Stops below the low were triggered
- Late sellers entered
- Smart money may have used the move to accumulate
- A quick reclaim of the broken level
- A strong reaction upward
- A higher low forming shortly after
These are the clues to watch next.
4. Reaction Zone: Price Pulls Into a Key Area
- A previous bullish displacement
- A strong rejection wick
- A clear shift in control earlier in the trend
- Buyers previously defended it
- It represents fair value
- It often acts as a decision point
If buyers step in again, the structure may recover.
5. The Decision Point: Higher Low or Breakdown?
- Selling pressure was absorbed
- Liquidity was swept
- Trend continuation becomes likely
- The BOS was genuine
- A deeper pullback may unfold
- Short‑term sentiment shifts bearish
This is the moment where the market reveals its intent.
6. Indicators Support the Pullback Narrative
- RSI in the low‑40s → momentum cooling
- Price below 20 EMA and 50 EMA → short‑term pressure
- Volume increased on the drop → participation confirmed
These support the idea of a meaningful pullback, but not necessarily a trend reversal.
⭐ Key Lessons From This Case Study
Sometimes it’s just a liquidity sweep.
Watch how price behaves when it returns to areas where buyers previously stepped in.
A higher low after a sweep is one of the strongest continuation signals.
They don’t predict — they support the story.
⭐ Summary
The next higher low — or failure to form one — will determine whether this was:
- A true shift in structure, or
- A stop‑run before continuation
This is the decision point.