- Chart Breakdown — Price Action Structure on March 26, 2026
In this Insight, we break down a real chart example to highlight how structure, liquidity, and market reactions unfold in live price action. The goal is to help you read the market with clarity and understand the story behind each move.
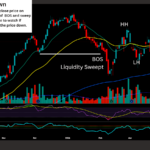
This chart highlights a clean sequence of price‑action events that often signal a potential shift in market behavior. After a liquidity sweep below a prior low, price rejected the level and broke structure to the upside. This BOS indicates that buyers temporarily regained control.
Following the break, price formed a Higher High (HH), showing bullish strength, then pulled back into a Lower High (LH). This combination often creates an “area to watch,” where the market reveals whether buyers can maintain momentum or if sellers will step back in.
At this stage, the key focus is observing how price reacts within this zone. A strong defense from buyers would support continuation, while weakness could signal a deeper retracement. This breakdown is meant to illustrate how structure, liquidity, and reaction zones work together in real‑time price action.
- Chart Breakdown — S&P/TSX Composite Index (March 23 Close)
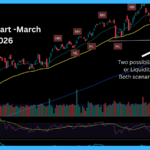
On the chart, price clearly pushed below the prior swing low, creating:
- A lower low
- A potential break of structure (BOS)
- A possible change of character (CHoCH)
This is the first meaningful sign of weakness after the recent upward leg.
The break itself is clean, but not impulsive — which keeps both scenarios open: true structural shift or liquidity sweep.
2. Liquidity Grab Is a Valid Possibility
The sweep below the low aligns with classic liquidity behavior:
- Stops below the low were triggered
- Sellers entered late
- Smart money may have used this to accumulate
If this was a liquidity sweep, we should see:
- A strong reaction upward
- A reclaim of the broken low
- A higher low forming above the sweep
This is the behavior to watch closely.
3. Price Is Pulling Back Into a Reaction Zone
The chart shows price pulling back into a zone created by:
- A previous bullish displacement
- A strong rejection wick
- A clear shift in control earlier in the trend
This zone is important because:
- Buyers previously defended it
- It represents a fair value area
- It often acts as a decision point
If buyers step in here, the structure may recover.
4. Higher Low Formation Will Reveal Intent
The next structural clue will be whether price forms a higher low after the sweep.
A higher low would signal:
- Absorption of selling
- Re‑accumulation
- Potential continuation of the larger trend
If price fails to form a higher low and instead breaks down again, the BOS was likely genuine.
5. Momentum Indicators Support the Pullback
From your chart:
- RSI is in the low‑40s → showing cooling momentum
- Price is below the 20 EMA and 50 EMA → short‑term pressure
- Volume increased on the drop → confirming participation
These support the idea of a meaningful pullback, but not necessarily a trend reversal.
6. Key Levels to Watch
Based on the chart:
Upside
- Reclaim of the broken low
- Reaction at the 20 EMA
- Sweep of minor highs inside the pullback
Downside
- Failure to hold the reaction zone
- Break below the liquidity sweep
- Continuation into deeper structure
Whichever side reacts first will set the tone for the next move.
⭐ Summary
The S&P/TSX chart shows a clean break below the previous low, signaling either:
- A true structural shift, or
- A liquidity sweep before continuation
The next higher low — or failure to form one — will reveal the market’s intent.