In this Insight, we break down a real chart example to highlight how structure, liquidity, and market reactions unfold in live price action. The goal is to help you read the market with clarity and understand the story behind each move.
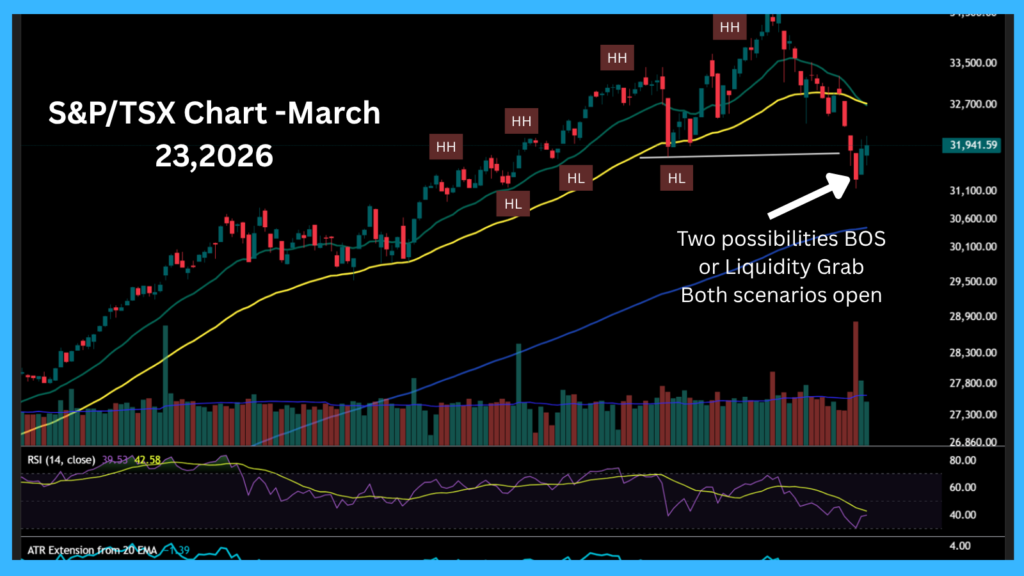
This chart highlights a clean sequence of price‑action events that often signal a potential shift in market behavior. After a liquidity sweep below a prior low, price rejected the level and broke structure to the upside. This BOS indicates that buyers temporarily regained control.
Following the break, price formed a Higher High (HH), showing bullish strength, then pulled back into a Lower High (LH). This combination often creates an “area to watch,” where the market reveals whether buyers can maintain momentum or if sellers will step back in.
At this stage, the key focus is observing how price reacts within this zone. A strong defense from buyers would support continuation, while weakness could signal a deeper retracement. This breakdown is meant to illustrate how structure, liquidity, and reaction zones work together in real‑time price action.