1. Break Below the Previous Swing Low
On the chart, price clearly pushed below the prior swing low, creating:
- A lower low
- A potential break of structure (BOS)
- A possible change of character (CHoCH)
This is the first meaningful sign of weakness after the recent upward leg.
The break itself is clean, but not impulsive — which keeps both scenarios open: true structural shift or liquidity sweep.
2. Liquidity Grab Is a Valid Possibility
The sweep below the low aligns with classic liquidity behavior:
- Stops below the low were triggered
- Sellers entered late
- Smart money may have used this to accumulate
If this was a liquidity sweep, we should see:
- A strong reaction upward
- A reclaim of the broken low
- A higher low forming above the sweep
This is the behavior to watch closely.
3. Price Is Pulling Back Into a Reaction Zone
The chart shows price pulling back into a zone created by:
- A previous bullish displacement
- A strong rejection wick
- A clear shift in control earlier in the trend
This zone is important because:
- Buyers previously defended it
- It represents a fair value area
- It often acts as a decision point
If buyers step in here, the structure may recover.
4. Higher Low Formation Will Reveal Intent
The next structural clue will be whether price forms a higher low after the sweep.
A higher low would signal:
- Absorption of selling
- Re‑accumulation
- Potential continuation of the larger trend
If price fails to form a higher low and instead breaks down again, the BOS was likely genuine.
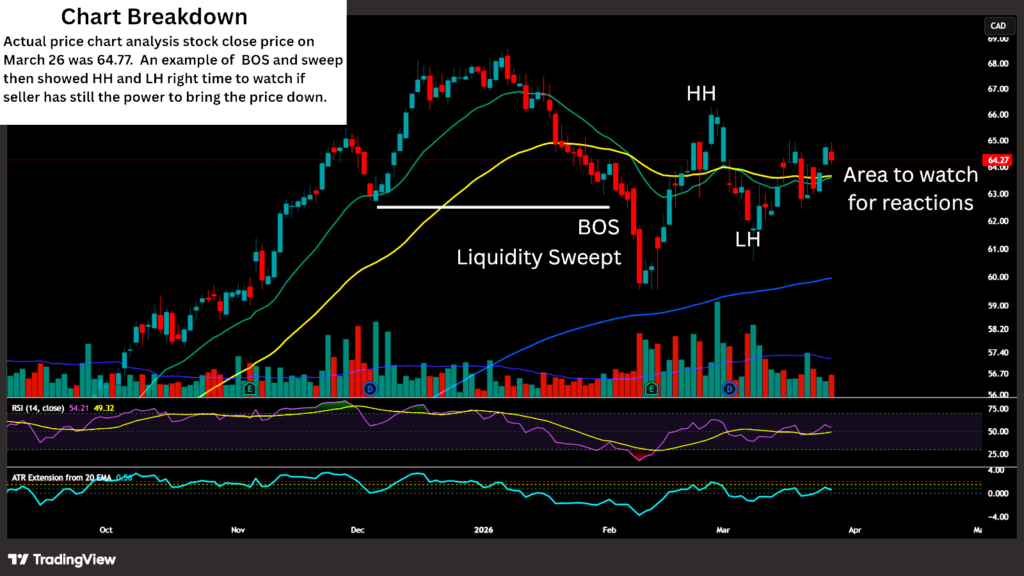
5. Momentum Indicators Support the Pullback
From your chart:
- RSI is in the low‑40s → showing cooling momentum
- Price is below the 20 EMA and 50 EMA → short‑term pressure
- Volume increased on the drop → confirming participation
These support the idea of a meaningful pullback, but not necessarily a trend reversal.
6. Key Levels to Watch
Based on the chart:
Upside
- Reclaim of the broken low
- Reaction at the 20 EMA
- Sweep of minor highs inside the pullback
Downside
- Failure to hold the reaction zone
- Break below the liquidity sweep
- Continuation into deeper structure
Whichever side reacts first will set the tone for the next move.
⭐ Summary
The S&P/TSX chart shows a clean break below the previous low, signaling either:
- A true structural shift, or
- A liquidity sweep before continuation
The next higher low — or failure to form one — will reveal the market’s intent.